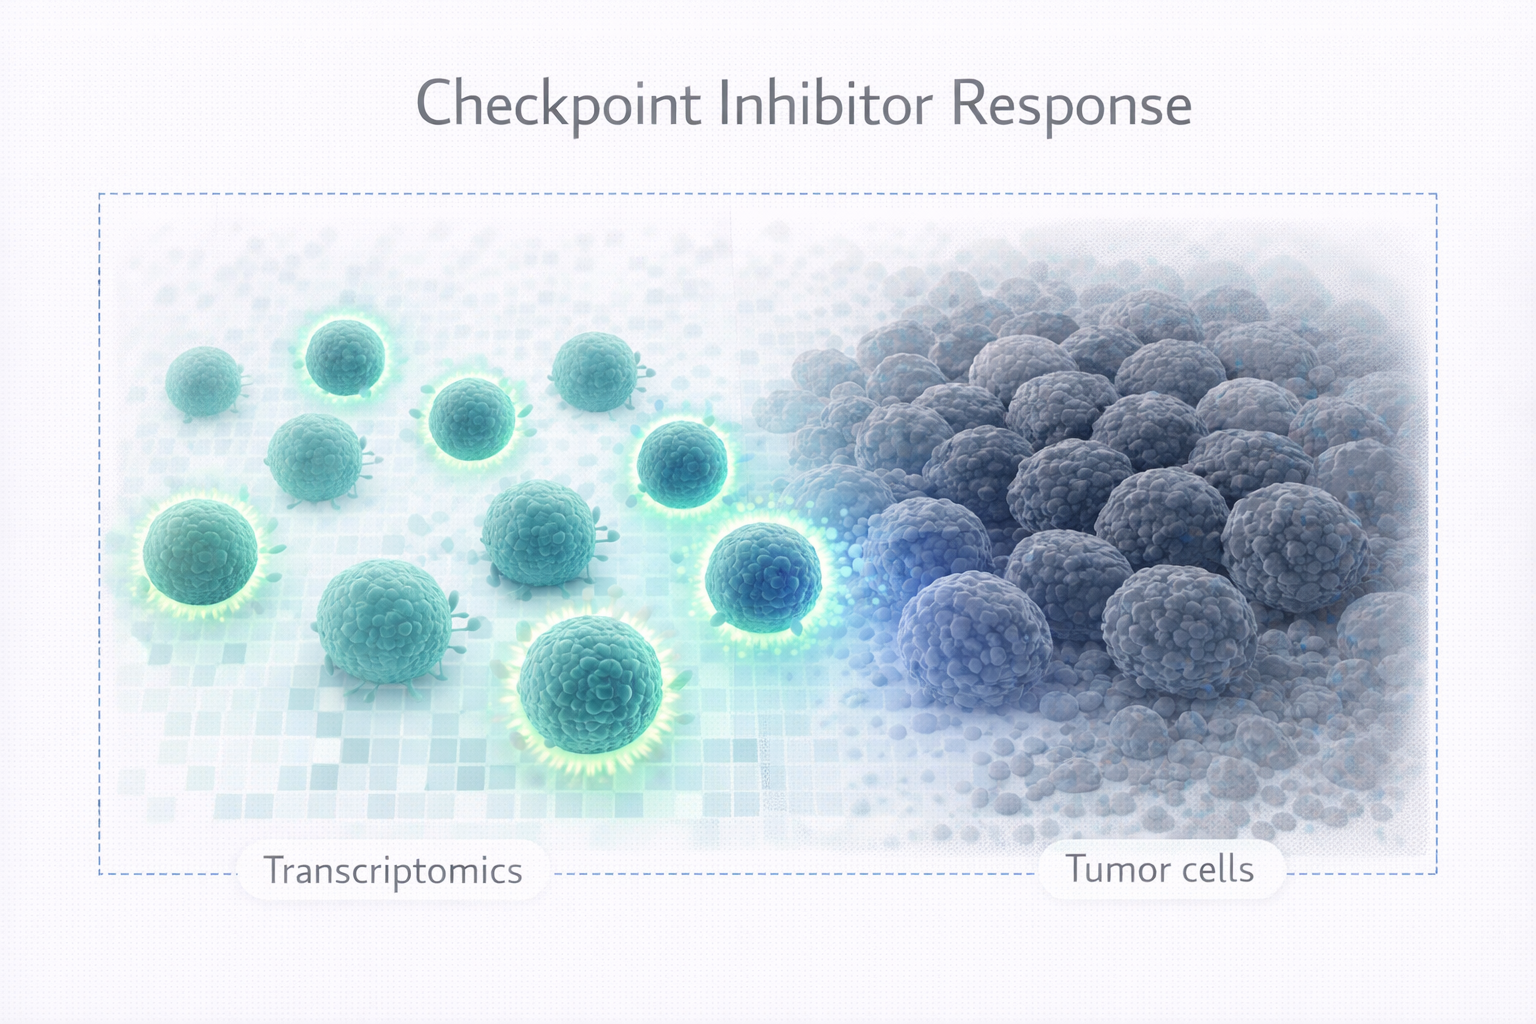
Predicting Checkpoint Inhibitor Response with Spatial Biology
A framework for using spatial transcriptomics to predict immunotherapy response, covering immune topology, checkpoint co-expression patterns, and composite scoring approaches.
Immunotherapy works — but only for a subset of patients, and we still struggle to predict who those patients are.
Anti-PD-1, anti-PD-L1, and anti-CTLA-4 antibodies produce durable responses across many tumor types (Ribas & Wolchok, 2018), but response rates vary widely depending on cancer type (Sharma & Allison, 2015). Spatial biology reframes the response prediction problem from “what is expressed?” to “where is it expressed and in what context?”
The patterns described here reflect commonly reported observations in spatial immuno-oncology studies and published literature, and are not specific to any individual dataset or project.
The Limitation of Bulk Biomarkers
Current FDA-approved biomarkers for ICI response — PD-L1 immunohistochemistry, tumor mutational burden (TMB), and microsatellite instability (MSI) — have significant limitations:
- PD-L1 IHC has low predictive accuracy (Herbst et al., 2014) — many PD-L1-negative patients respond, and many PD-L1-positive patients don’t
- TMB is an imperfect proxy for neoantigen load (Chan et al., 2019) and doesn’t account for antigen presentation machinery
- MSI identifies a small subset of patients with near-certain benefit but says nothing about the majority
All three are bulk measurements that ignore the spatial organization of the tumor-immune interaction — which is arguably the most important factor in determining whether an anti-tumor immune response can succeed.
What Spatial Profiling Adds
Spatial technologies like GeoMx DSP (Merritt et al., 2020) allow researchers to measure gene expression in defined tissue regions: tumor core, tumor margin, stroma, and immune-enriched zones. This spatial resolution reveals patterns invisible to bulk approaches.
Immune Topology
The same number of T cells can mean completely different biology depending on where they are (Chen & Mellman, 2017). The location of immune cells matters as much as their presence:
- Immune-infiltrated tumors: T cells within the tumor core, often associated with better ICI response
- Immune-excluded tumors: T cells abundant at the tumor margin but unable to penetrate. These patients often don’t respond to single-agent ICI.
- Immune-desert tumors: Few or no T cells anywhere. These patients almost never respond to ICI alone.
Spatial profiling can quantify these patterns by comparing immune cell deconvolution estimates across tumor, margin, and stroma compartments.
Checkpoint Co-Expression Patterns
Multiple checkpoint receptors and ligands are often co-expressed, and the pattern of co-expression can be more informative than any single marker:
- PD-1 + LAG-3 + TIM-3 co-expression on T cells suggests terminal exhaustion (Wherry, 2011); (Wei et al., 2017) — these cells may be too dysfunctional to be “reinvigorated” by single-checkpoint blockade
- PD-1 alone (without other exhaustion markers) suggests a “pre-exhaustion” state where checkpoint blockade is most effective
- PD-L1 on tumor cells vs. PD-L1 on macrophages may have different predictive value — spatial profiling can distinguish between these sources
The Exhaustion Spectrum
Not all T cells are equal — functional state matters as much as presence. T cell exhaustion is not binary (Miller et al., 2019). It exists on a spectrum from “progenitor exhausted” (TCF7+, SLAMF6+) — which retain proliferative potential and respond to ICI — to “terminally exhausted” (TOX+, EOMES+) — which are largely refractory to treatment.
Spatial expression profiling of exhaustion-associated genes across tumor compartments can estimate where on this spectrum the local T cell population falls:
Responsive signatures:
- TCF7 (progenitor marker)
- CXCL13 (tissue-resident effector)
- IFNG (active cytokine production)
- GZMB, PRF1 (cytotoxic capacity retained)
Refractory signatures:
- TOX (exhaustion transcription factor)
- EOMES (terminal differentiation)
- Multiple co-inhibitory receptors (HAVCR2, LAG3, TIGIT)
- Low proliferation markers (MKI67-)
Analytical Framework for Response Prediction
Response prediction is inherently multi-dimensional. Here’s a practical framework for spatial response prediction:
Step 1: Compartment-Specific Profiling
Profile at least three compartments per tumor:
- Tumor: Gene expression in the malignant epithelium
- Stroma: Gene expression in the tumor-adjacent fibroblast/vascular compartment
- Immune: Gene expression in immune-enriched regions (ideally further subdivided into CD8+ and CD68+ zones)
Step 2: Deconvolution
Estimate cell type proportions in each compartment. Key populations to resolve:
- CD8+ T cells (effector and exhausted subsets)
- Regulatory T cells (immunosuppressive)
- M1 vs. M2 macrophages (pro-inflammatory vs. immunosuppressive)
- NK cells (innate cytotoxicity)
- Dendritic cells (antigen presentation)
Step 3: Pathway Scoring
Calculate per-compartment scores for key immune pathways:
- T cell activation score
- T cell exhaustion score
- Interferon signaling score
- Antigen presentation score
- Immunosuppression score (TGF-beta, IDO1, ARG1)
Step 4: Cross-Compartment Correlations
The most informative features for response prediction are often cross-compartment:
- Tumor PD-L1 expression correlated with immune compartment CD8+ T cell density
- Stromal TGF-beta expression correlated with immune exclusion (low tumor-core T cells despite high margin T cells)
- Tumor neoantigen-associated gene expression correlated with dendritic cell infiltration
Step 5: Composite Scoring
No single marker reliably predicts ICI response. Composite scores that integrate:
- Cell type proportions (from deconvolution)
- Pathway activity (from expression scoring)
- Spatial relationships (from cross-compartment analysis)
…consistently outperform individual biomarkers. The challenge is developing scores that are robust across cohorts and platforms — an active area of research.
Recurring Patterns in the Literature
Several patterns have been consistently reported across spatial immunotherapy studies:
-
Checkpoint expression in the tumor compartment is necessary but not sufficient. High PD-L1 on tumor cells means nothing if there are no T cells to be “un-braked.”
-
The stroma is underappreciated. Stromal gene expression — particularly TGF-beta pathway components and fibroblast activation markers — has been reported as an important contributor to immune exclusion. Ignoring the stroma means ignoring a major determinant of response.
-
Response prediction benefits from temporal context. Pre-treatment profiling captures the baseline immune landscape, but changes during early on-treatment timepoints can be more predictive than any baseline measurement alone. If your study design allows longitudinal spatial sampling, this is extremely valuable data.
-
Partial responders may provide critical insight. Patients who initially respond but then progress may have spatial patterns that differ from both complete responders and non-responders. Understanding partial response at the spatial level could inform combination therapy strategies.
Limitations and Challenges
It’s important to acknowledge that spatial response prediction is still an emerging field with significant challenges:
- Small cohort sizes: Most spatial immunotherapy studies are underpowered for robust biomarker validation
- Lack of standardized scoring: There is no consensus on how to calculate or combine spatial immune scores across studies
- Platform variability: Results from GeoMx, CosMx, MERFISH, and Visium are not directly comparable without careful harmonization
- Temporal complexity: Single-timepoint profiling captures a snapshot, not the dynamic immune response
The Path Forward
Large, prospectively designed spatial profiling studies with matched response data are needed to move from discovery to clinical utility.
The biology is complex — but the tools to measure it are finally catching up. Spatial platforms can now profile dozens of immune markers across hundreds of tissue regions in a single experiment. The analytical frameworks exist. What’s needed is the translational commitment to close the gap between spatial discovery and clinical decision-making.
At Cytogence, we support immunotherapy research programs with comprehensive spatial profiling analysis — from experimental design and deconvolution through pathway scoring and response prediction modeling. If you’re running an immunotherapy study and want to extract spatial immune insights from your tissue samples, we’d be glad to help.
References
-
Ribas A, Wolchok JD. Cancer immunotherapy using checkpoint blockade. Science. 2018;359(6382):1350-1355. doi: 10.1126/science.aar4060. PMID: 29567705.
-
Sharma P, Allison JP. The future of immune checkpoint therapy. Science. 2015;348(6230):56-61. doi: 10.1126/science.aaa8172. PMID: 25838373.
-
Herbst RS, Soria JC, Kowanetz M, et al. Predictive correlates of response to the anti-PD-L1 antibody MPDL3280A in cancer patients. Nature. 2014;515(7528):563-567. doi: 10.1038/nature14011. PMID: 25428504.
-
Chen DS, Mellman I. Elements of cancer immunity and the cancer-immune set point. Nature. 2017;541(7637):321-330. doi: 10.1038/nature21349. PMID: 28102259.
-
Miller BC, Sen DR, Al A> A, et al. Subsets of exhausted CD8+ T cells differentially mediate tumor control and respond to checkpoint blockade. Nature Immunology. 2019;20(3):326-336. doi: 10.1038/s41590-019-0312-6. PMID: 30778252.
-
Wherry EJ. T cell exhaustion. Nature Immunology. 2011;12(6):492-499. doi: 10.1038/ni.2035. PMID: 21739672.
-
Wei SC, Levine JH, Cogdill AP, et al. Distinct cellular mechanisms underlie anti-CTLA-4 and anti-PD-1 checkpoint blockade. Cell. 2017;170(6):1120-1133. doi: 10.1016/j.cell.2017.07.024. PMID: 28803728.
-
Chan TA, Yarchoan M, Jaffee E, et al. Development of tumor mutation burden as an immunotherapy biomarker: utility for the oncology clinic. Annals of Oncology. 2019;30(1):44-56. doi: 10.1093/annonc/mdy495. PMID: 30395155.
-
Merritt CR, Ong GT, Church SE, et al. Multiplex digital spatial profiling of proteins and RNA in fixed tissue. Nature Biotechnology. 2020;38(5):586-599. doi: 10.1038/s41587-020-0472-9. PMID: 32393914.
Cytogence provides bioinformatics consulting for immuno-oncology, spatial transcriptomics, and biomarker development. Get in touch to learn more.