Cytogence FCS
A high-performance flow cytometry analysis platform built from the ground up in Rust, pairing an AI copilot with a flow-cytometry-trained gating model that proposes gates for you to review. On the desktop today, with a web alpha launching soon.
Prefer to read first?
Built in Rust
Native engine built for large event files, with GPU-accelerated plots.
AI Copilot
Automated gating and strategy suggestions powered by LLMs.
Privacy First
All analysis runs locally. Your data never leaves your machine.
Cross-Platform
Windows, macOS, and Linux with identical features.
Everything you need for flow cytometry analysis
From file loading to publication-ready figures, Cytogence FCS covers the entire analysis workflow.
A gating model trained on real flow cytometry data
Alongside the AI copilot, Cytogence FCS includes a second AI — a model trained specifically on flow cytometry data to identify cell populations. The copilot brings broad reasoning; the trained model brings cytometry expertise. Together they propose a complete gating strategy that you review and approve.
Works across panels & species
It recognizes markers by their biology, not by the fluorochrome or instrument they were measured on — so it generalizes to panels and species it wasn't trained on.
Knows what it knows
The model reports its own confidence and flags data that looks unfamiliar, so you always know when a suggestion is well-grounded and when it isn't.
Hands off to the copilot
The trained model gates the populations it's confident about; the AI copilot fills in the rest — yielding one complete, hierarchical gating strategy instead of a partial answer.
Improves from your corrections
When you adjust a gate, the model can learn from it — opt-in and quality-checked — so its coverage grows over time without compromising what it already does well.
Now part of Cytogence FCS, working alongside the AI copilot.
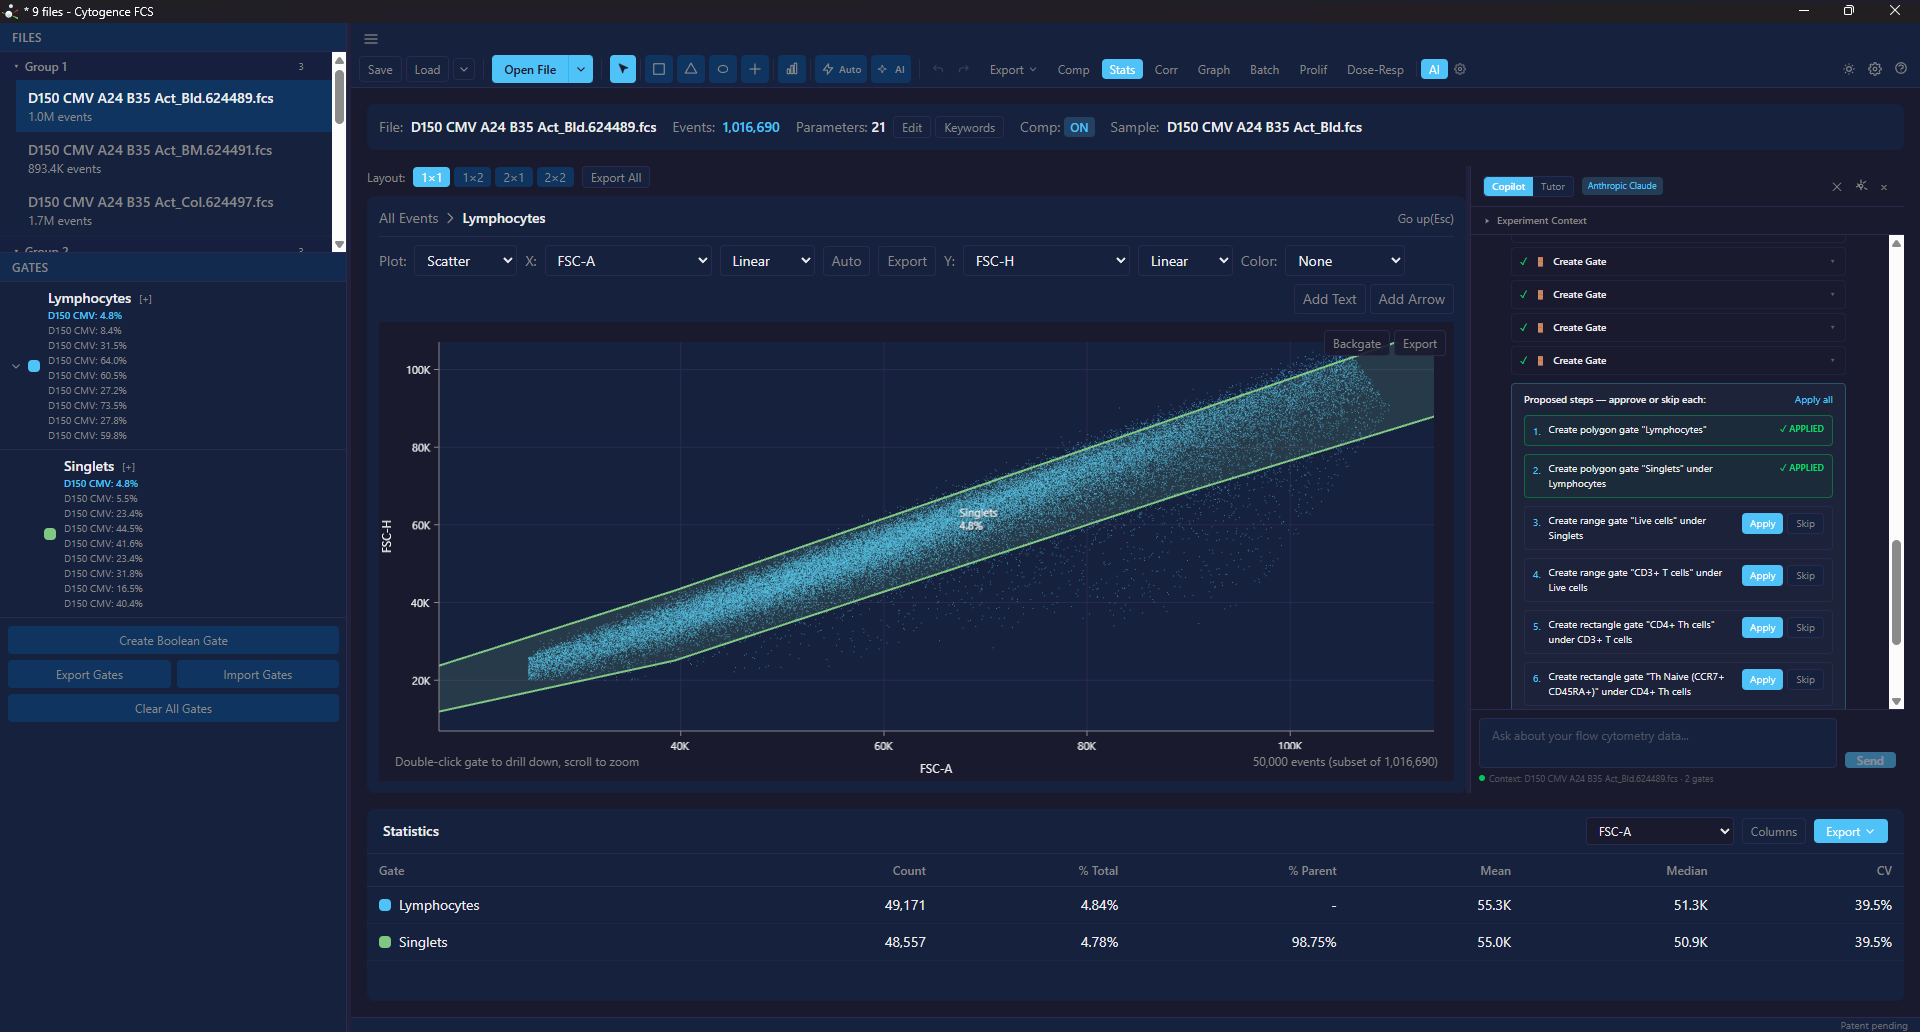
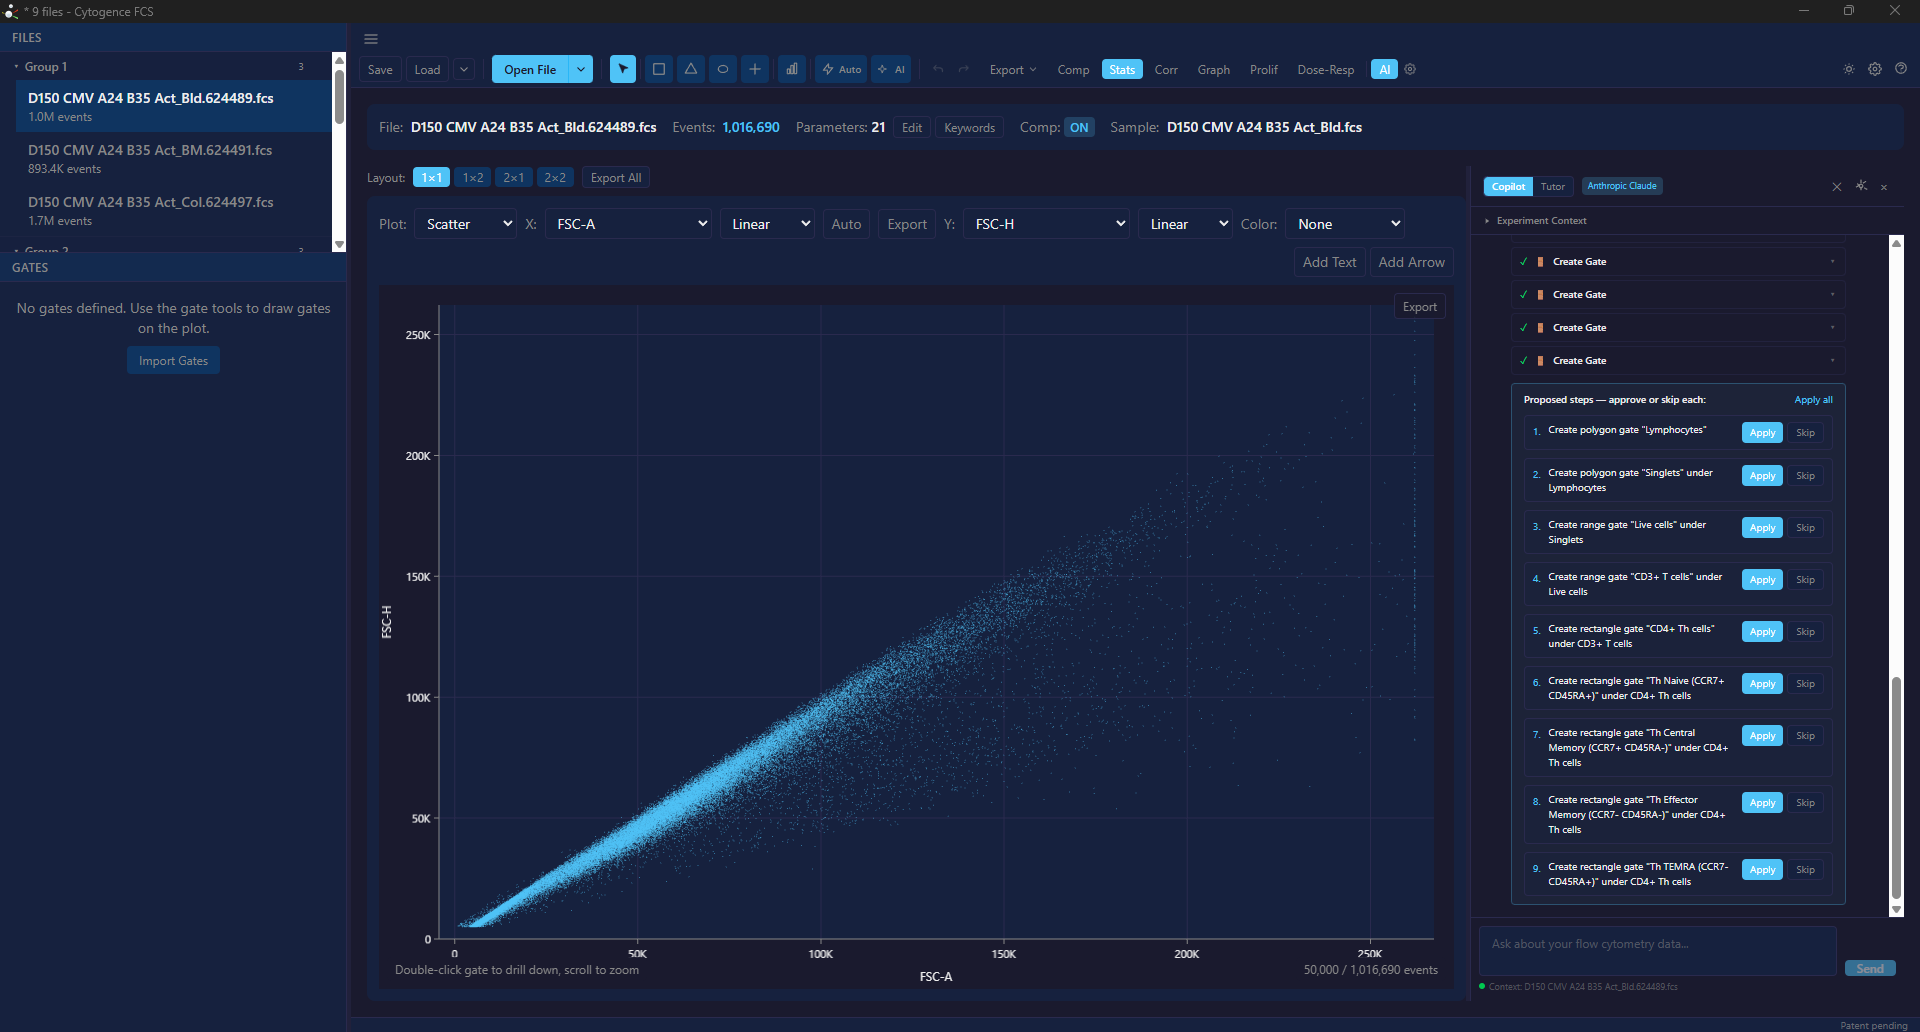
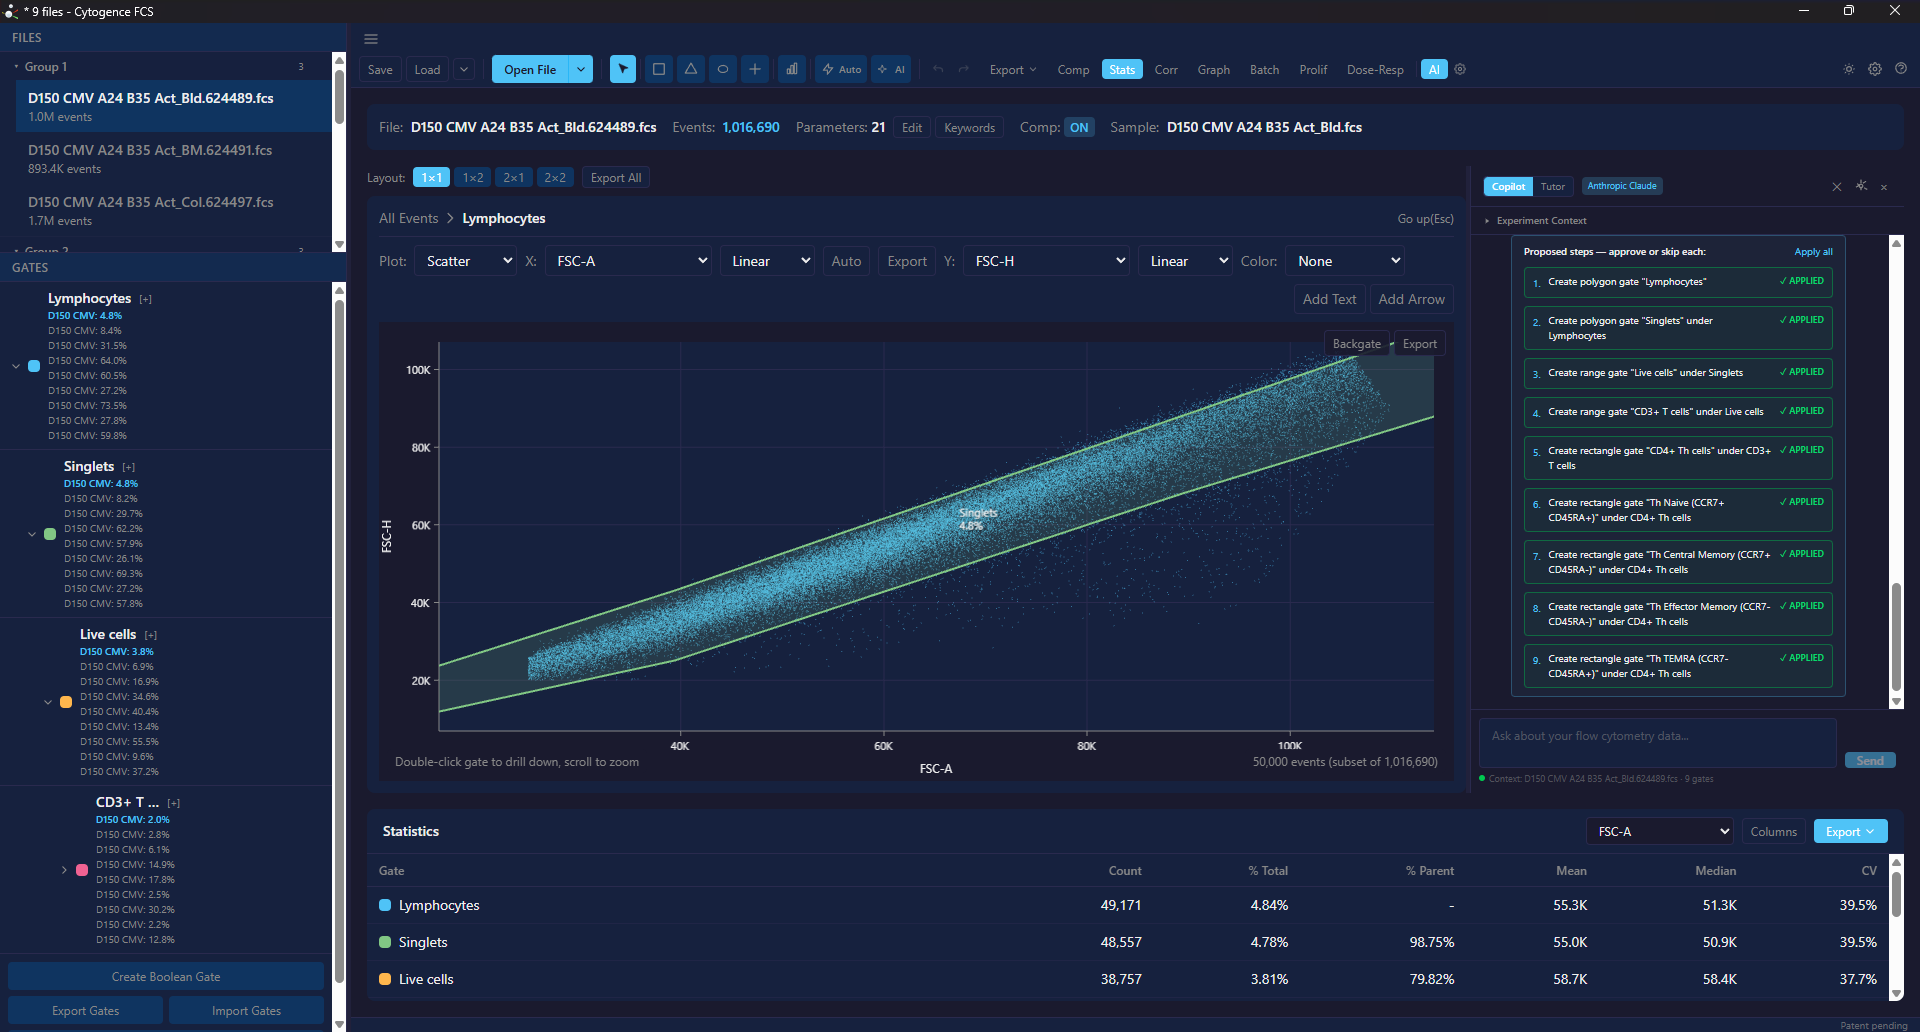
AI proposes, you approve
The copilot works through your data step by step and proposes each gate with a plain-language rationale — nothing is applied until you commit it. Every suggestion, tool call, and result is kept in a transparent, per-step log, so the analysis stays reviewable and reproducible.
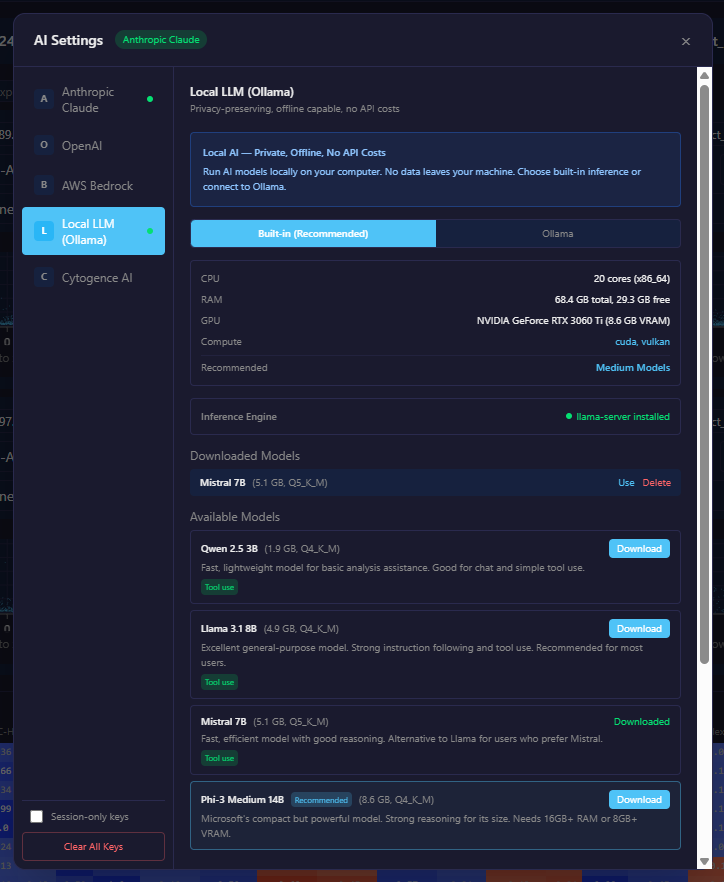
Multi-Provider AI Copilot
Choose from Claude, OpenAI, AWS Bedrock, or run local models via Ollama. Two assistant modes: Copilot for analysis and Tutor for learning.
ML Auto-Gating
Three clustering algorithms — K-means, DBSCAN, and Gaussian Mixture Models with BIC-based model selection — for unsupervised population identification.
AI-Exposed Analysis Tools
The AI assistant can create gates, compute statistics, suggest strategies, analyze distributions, name populations, and run statistical tests — all with your approval.
Professional-grade analysis tools
Built on validated statistical methods and a comprehensive gating engine that supports hierarchical gate trees, boolean operations, and real-time population statistics.
Complete Gate Types
Rectangle, polygon, ellipse, range, quadrant, and boolean (AND/OR/NOT) gates with full hierarchy support, undo/redo, and real-time statistics.
5 Transform Types
Linear, logarithmic, biexponential (logicle), arcsinh, and hyperlog transforms with automatic tick generation for proper axis scaling.
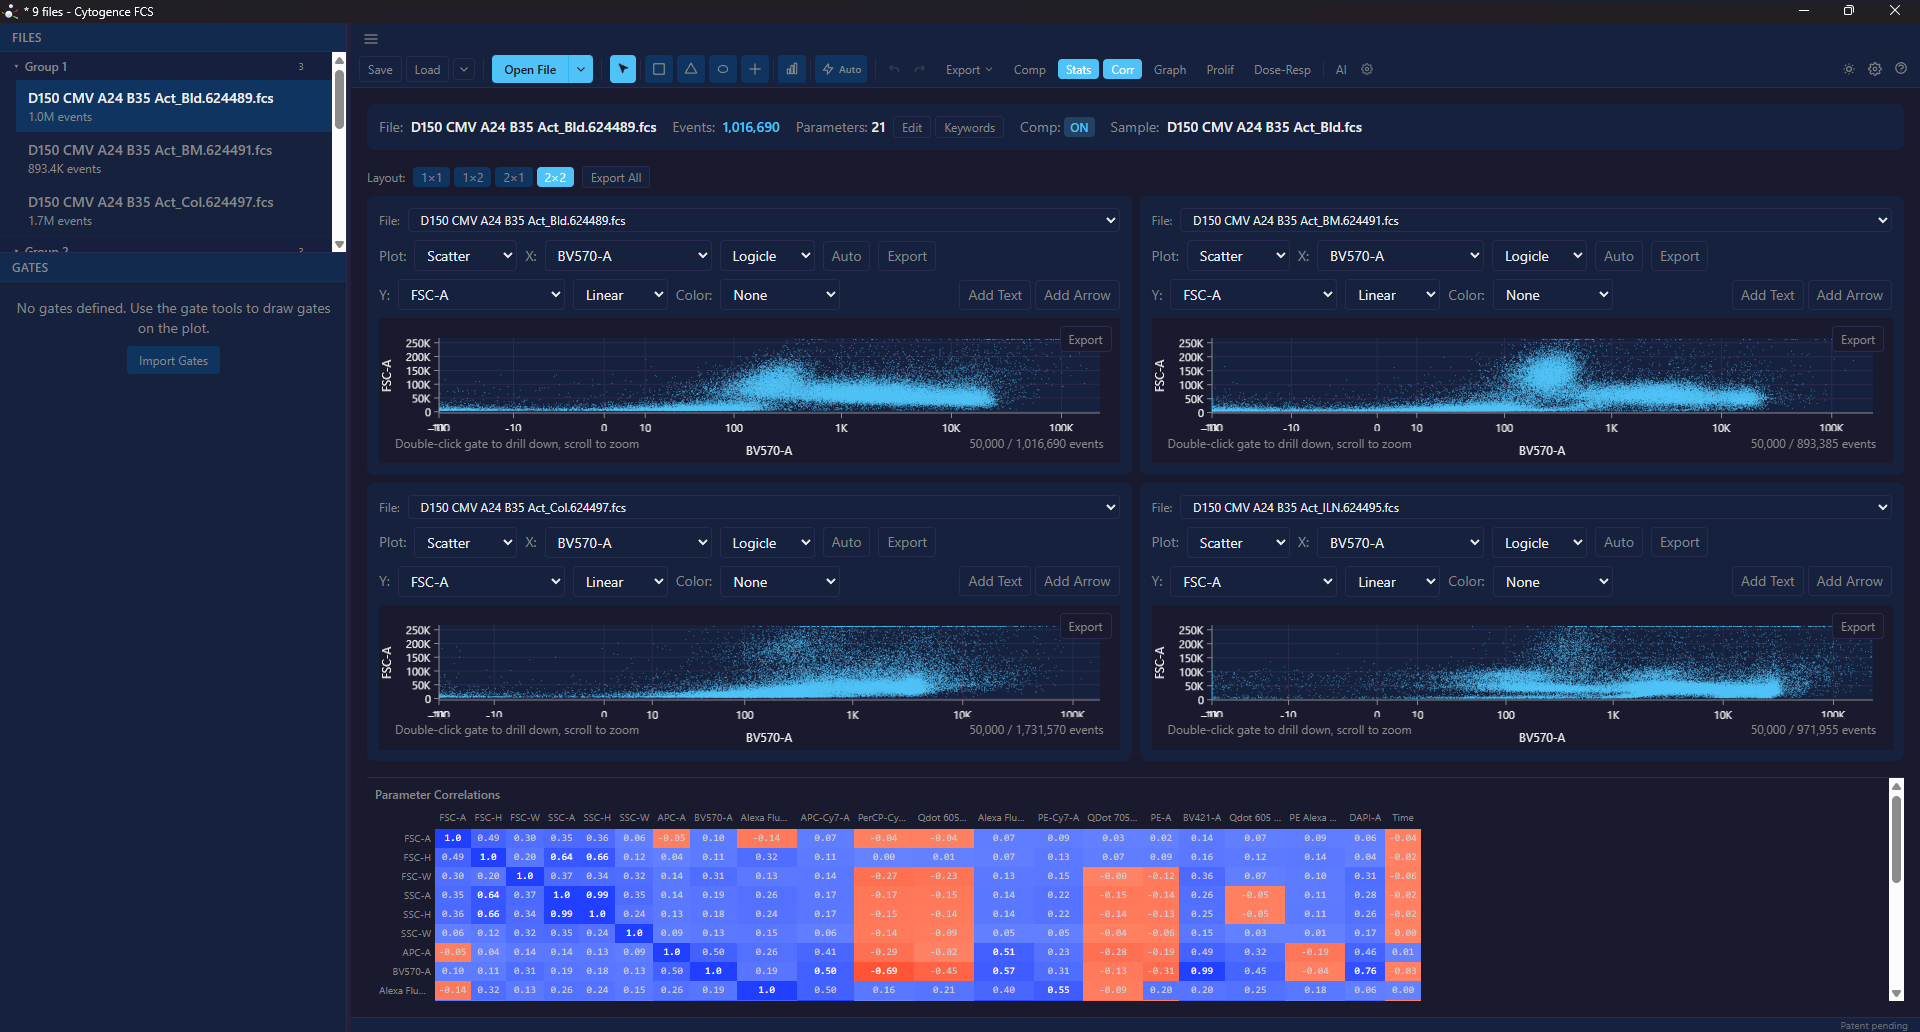
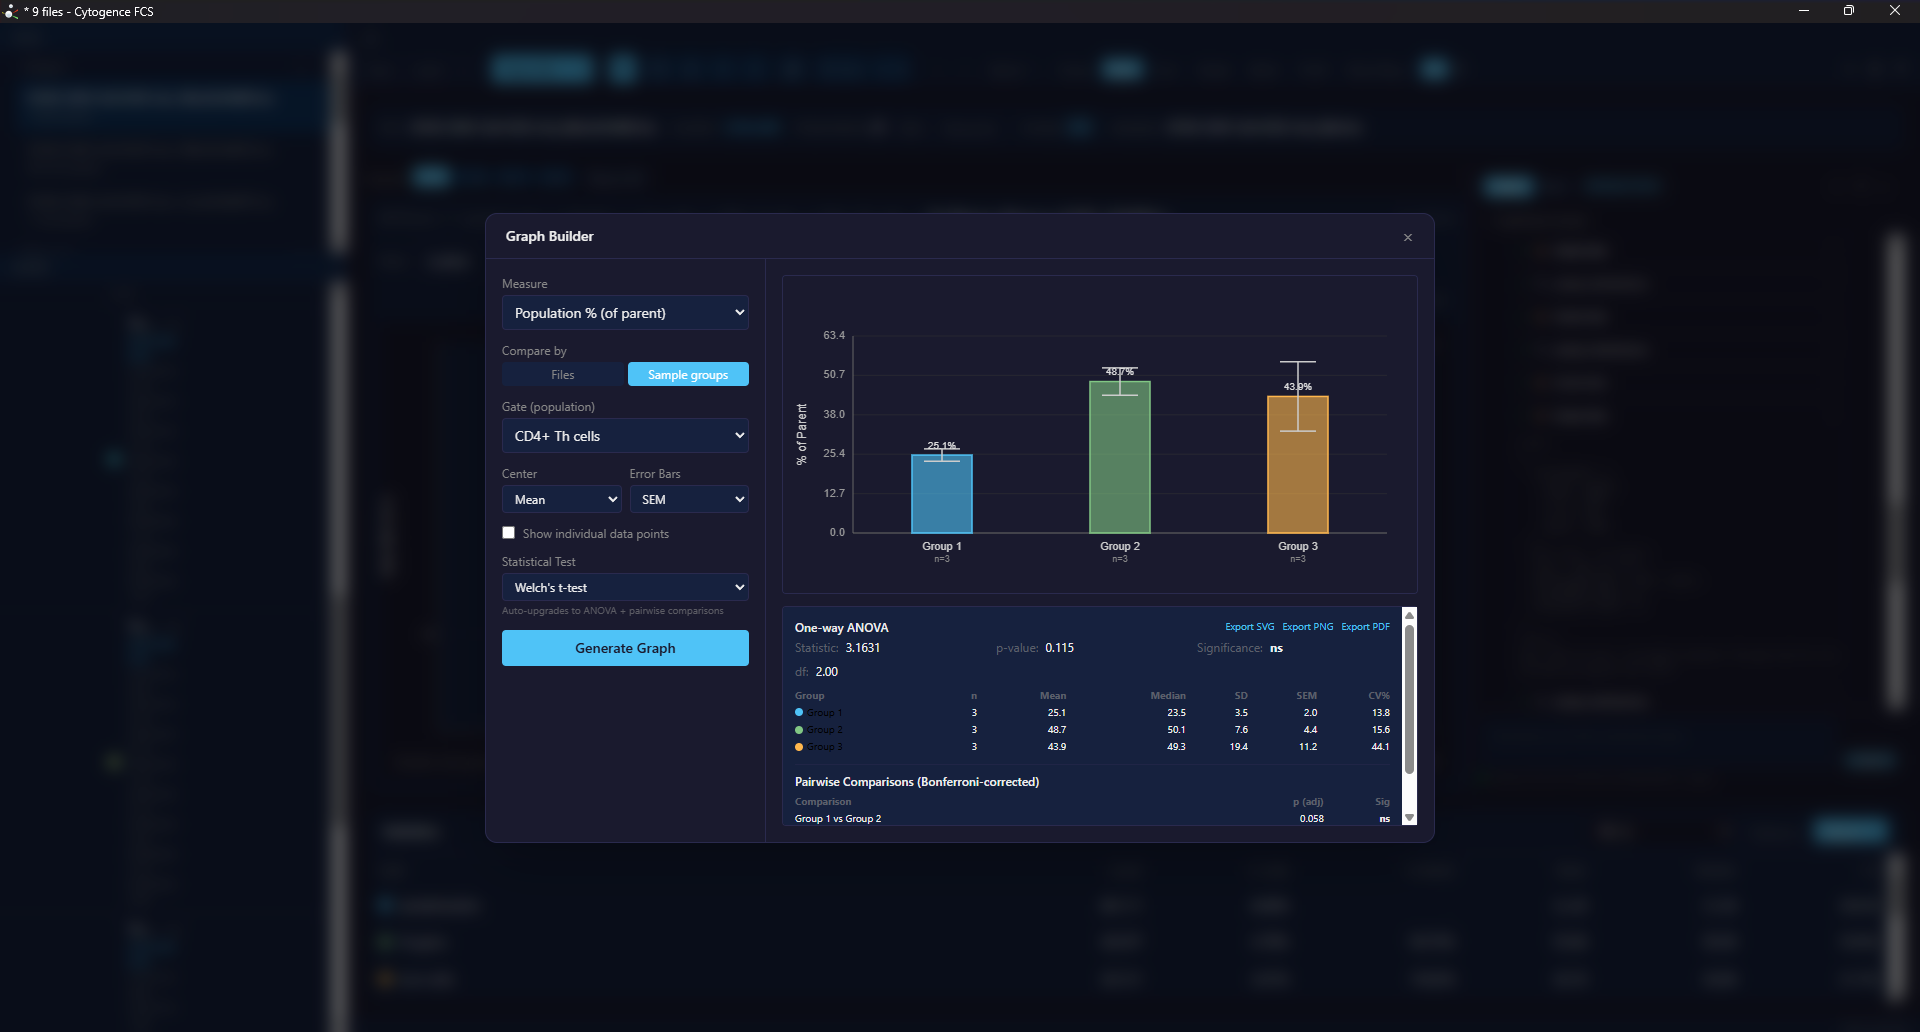
Comprehensive Statistics
Mean, median, geometric mean MFI, robust CV, plus paired/unpaired t-tests, ANOVA, Kruskal-Wallis, and Mann-Whitney U tests.
Propose, then approve — see it in action
The copilot lays out a full gating strategy with a rationale for each step. You execute the steps you agree with; gates and statistics update instantly. Nothing is applied without your click.
Cloud or fully local — you choose
Run the AI copilot on a frontier cloud model, or entirely on your own machine. Cytogence FCS ships built-in local inference and detects your hardware to pick a fitting model — so sensitive data can stay on-device.
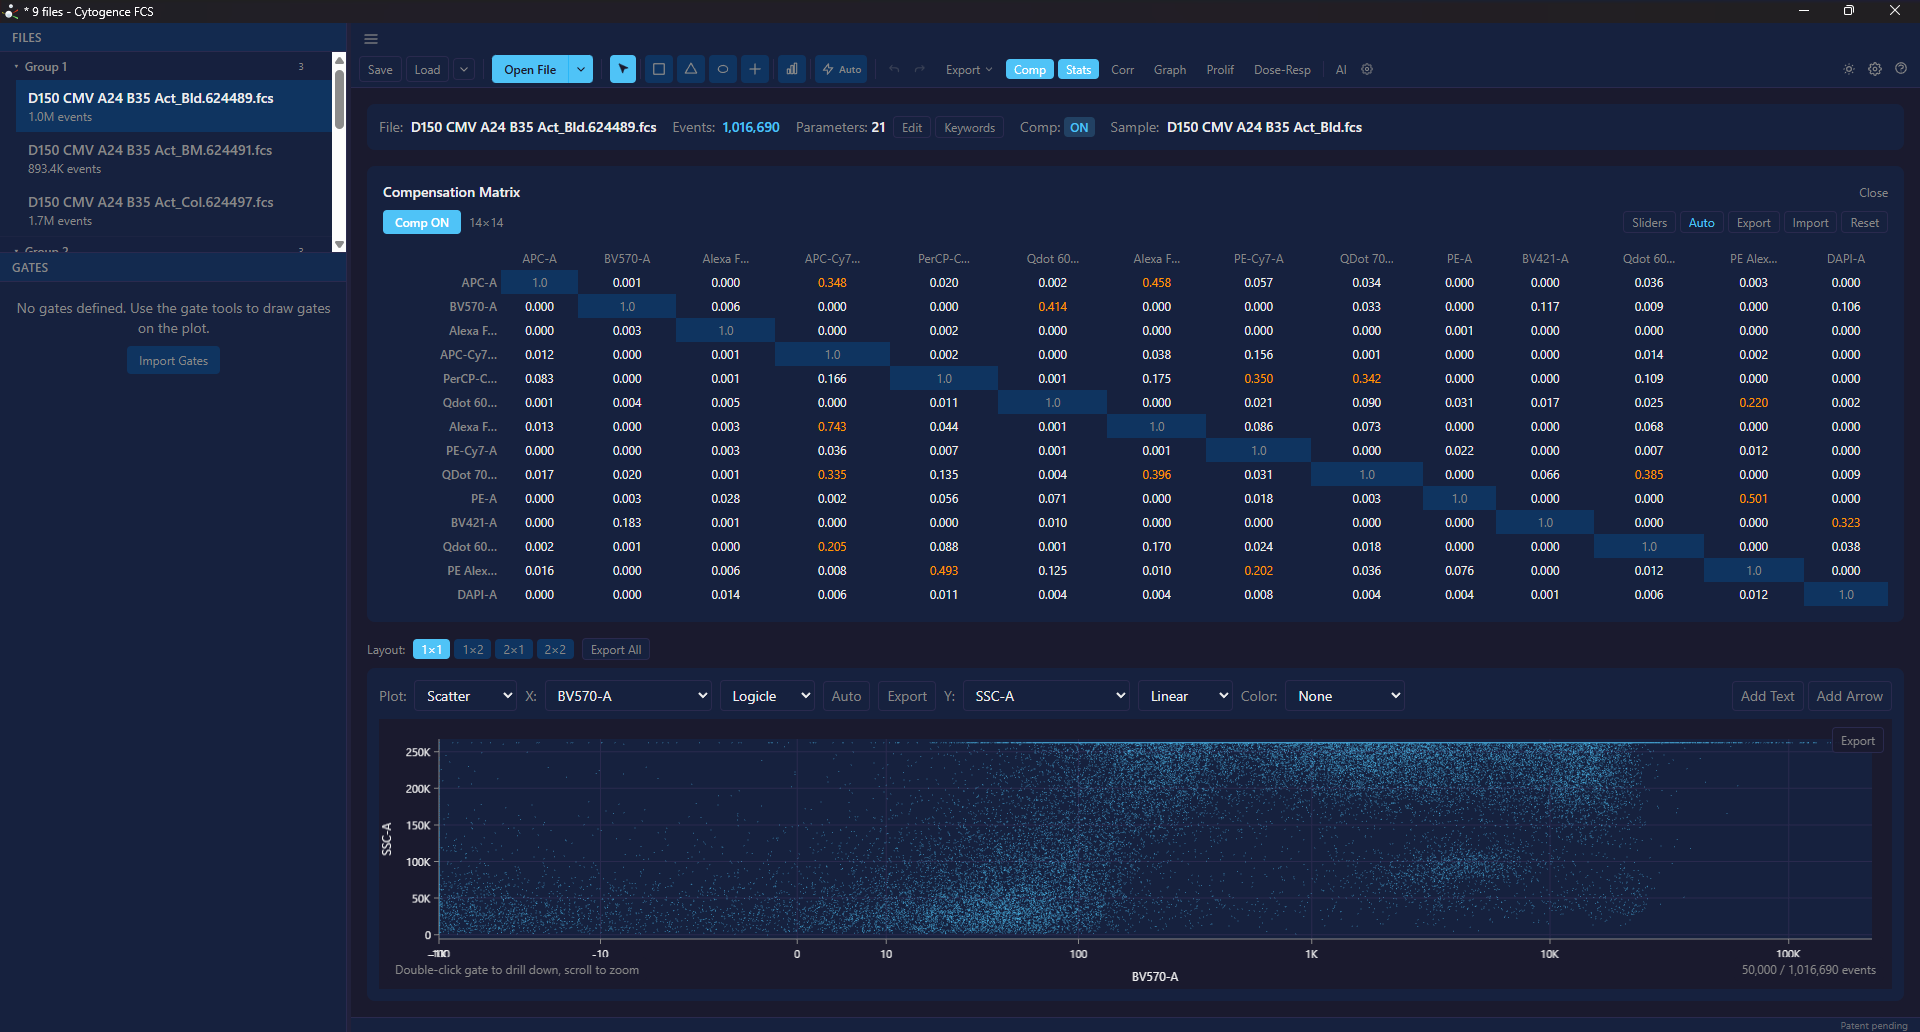
Auto-Compensation
Calculate spillover matrices from single-stain controls with diagnostic metrics including stain index and FMO thresholds. Import/export matrices for sharing.
Proliferation Analysis
GMM-based dye dilution modeling with automatic generation peak fitting. Calculates division index, proliferation index, percent divided, and expansion index.
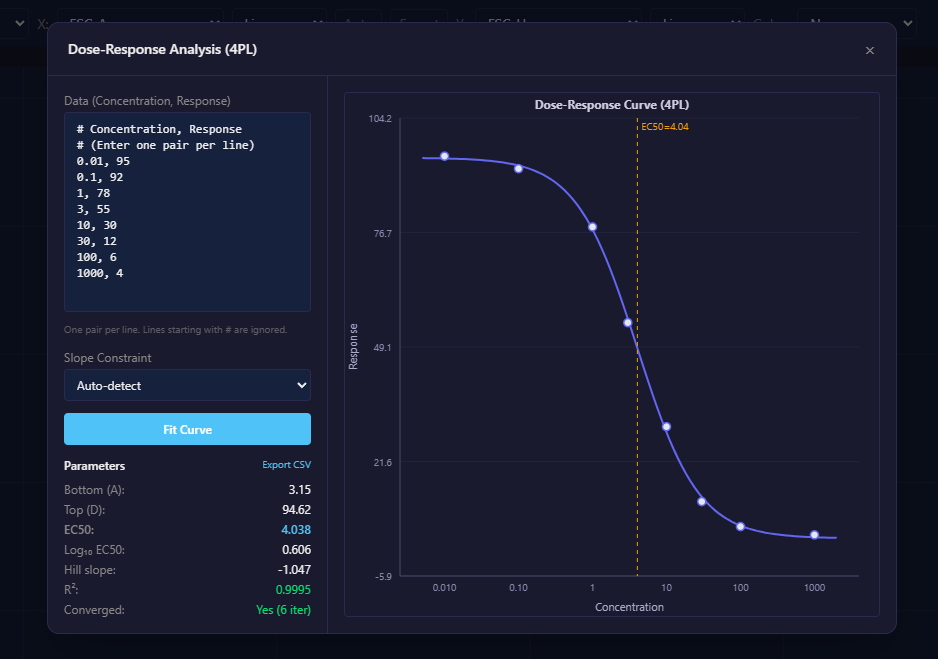
Dose-Response Fitting
4-parameter logistic (4PL) curve fitting with Levenberg-Marquardt optimization. EC50/IC50 calculation with R² goodness-of-fit and convergence diagnostics.
GPU-Accelerated Plots
Scatter, histogram, density, contour, zebra, and overlay plots rendered via PixiJS with WebGPU/WebGL. Interactive zoom, pan, and configurable point rendering.
Publication-Ready Export
Export plots as SVG or PDF vector graphics for journals, or PNG for presentations. Export statistics and event data as CSV for downstream analysis.
Workspace Persistence
Save complete analysis sessions — files, gates, compensation, plot views — and restore them later, with a recent-files list to pick up where you left off.
A complete analysis workspace
Gating is only the start. Visualize, compensate, compare groups, and fit curves — then export publication-ready figures, all in one place.
Full FCS Standard Support
Cytogence FCS reads FCS 2.0, 3.0, and 3.1 files with support for integer, float, double, and ASCII data types. Drag and drop files to get started — metadata, parameters, and spillover matrices are extracted automatically.
Run it on your desktop — or in the browser
The same analysis engine, available two ways. Start on the desktop today; a browser-based version is on the way.
Desktop application
Native Windows, macOS, and Linux. Your data — and, in strict mode, the AI itself — stays entirely on your machine. Best for large files and privacy-sensitive work.
Request a DemoCytogence FCS on the web
A browser-based version is coming soon at fcs.cytogence.com — nothing to install, the same gating workflow. Invite-only during the alpha.
Request Alpha AccessReady to try Cytogence FCS?
Request a demo and see how AI-powered flow cytometry analysis can accelerate your research workflow.
Or