Understanding Immune Cell Infiltration in Cancer Using Spatial Profiling
A comprehensive guide to characterizing tumor immune landscapes using spatial profiling with GeoMx DSP, including compartment-specific analysis and immune cell deconvolution.
Whether a tumor responds to immunotherapy often depends on one thing: its immune microenvironment.
Tumors are often categorized as “immune-hot” (infiltrated, inflamed) or “immune-cold” (excluded or desert), with major implications for therapy response. The types of immune cells present — cytotoxic T cells versus regulatory T cells, M1 versus M2 macrophages — can mean the difference between response and resistance.
Spatial profiling technologies like NanoString’s GeoMx DSP (Merritt et al., 2020) have given us unprecedented ability to characterize this immune landscape — turning immune analysis from a bulk measurement into a map. But extracting meaningful biology from spatial immune profiling data requires careful analytical design.
The patterns described here reflect commonly observed trends across spatial immunology studies and published datasets, and are not specific to any individual project or dataset.
Why Spatial Context Matters
Bulk RNA-seq from a tumor biopsy gives you an average. If 30% of your tissue is highly inflamed and 70% is immune-desert, the average looks moderately inflamed — a misleading picture that obscures the biologically relevant heterogeneity.
Spatial profiling preserves what averaging destroys: the location and neighborhood of immune activity. Key questions that require spatial resolution include:
- Are immune cells at the tumor periphery (excluded) or infiltrating the tumor core?
- Do regions of high checkpoint expression co-localize with regions of high T cell density?
- Is immune infiltration associated with specific tumor subtypes or differentiation states?
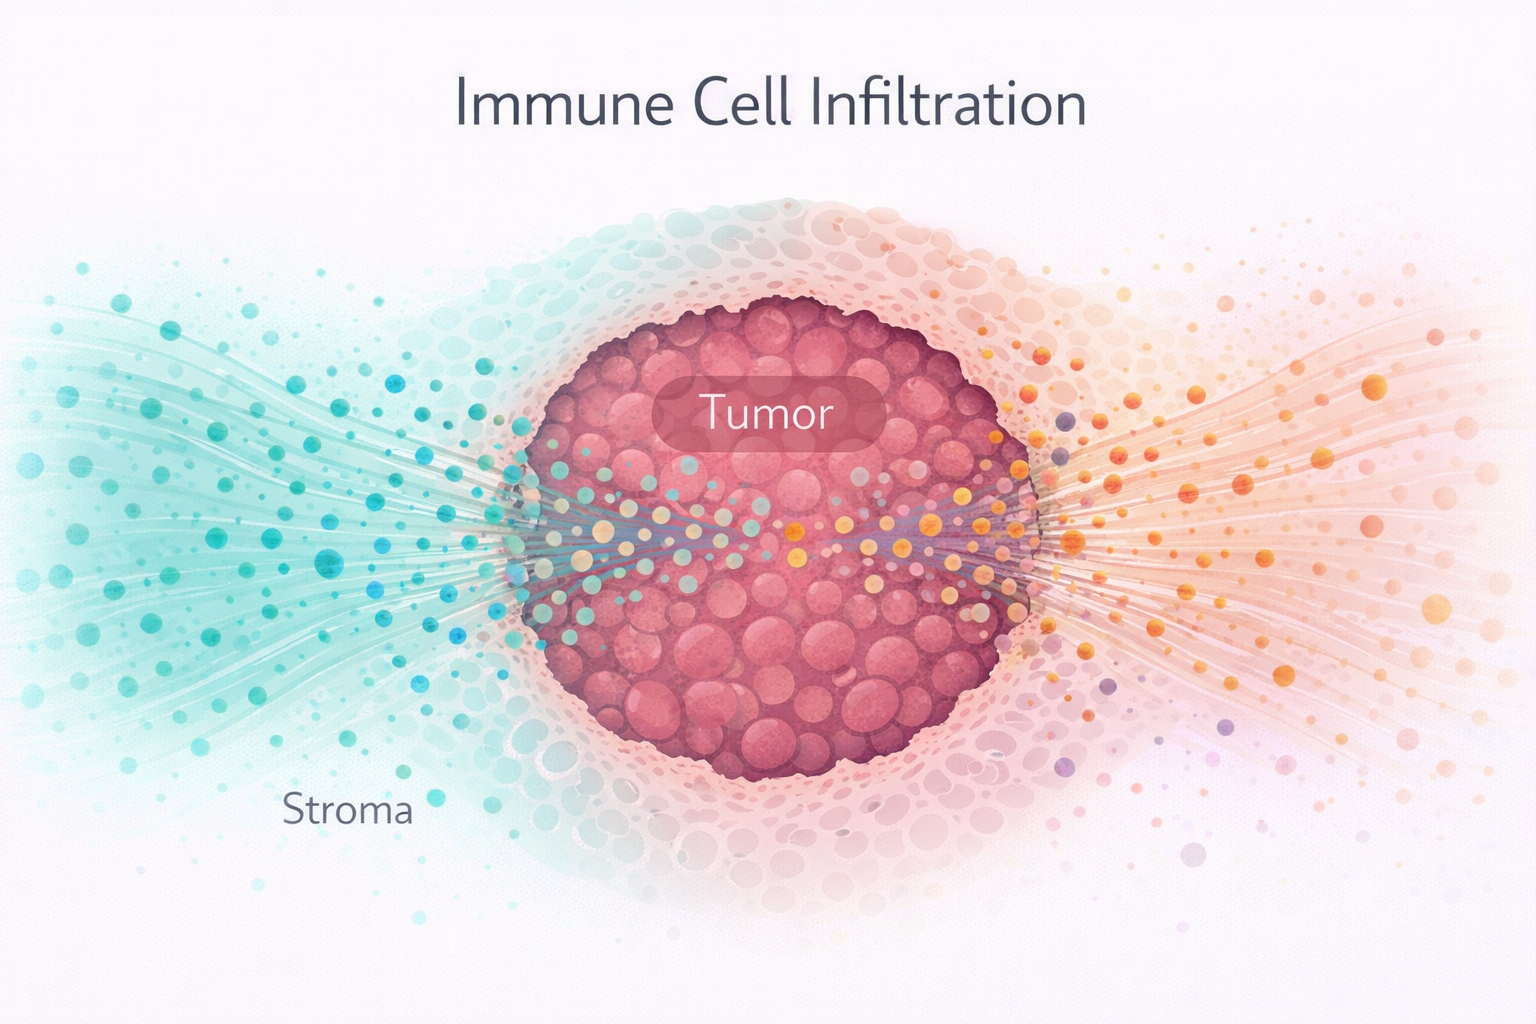
Compartment-Specific Analysis: A Non-Negotiable
Across spatial immunology studies, one principle has proven itself repeatedly: analyze each tissue compartment separately.
A tumor region, its adjacent stroma, and the immune-enriched zones at the tumor margin have fundamentally different cellular compositions and different biological programs. Pooling them together obscures the very patterns you’re trying to find.
In a typical analysis, evaluating whether a biomarker predicts immune infiltration may yield different relationships across compartments:
- Tumor compartment: The biomarker might correlate with checkpoint expression (because tumor cells produce both the biomarker and checkpoint ligands)
- Stroma compartment: The same biomarker might show no correlation (because stromal cells don’t express it)
- Immune compartment: The biomarker might show a negative correlation (reflecting an inverse relationship between epithelial markers and immune cell abundance)
If you analyze all compartments together, these signals cancel out, and you conclude there’s no relationship. Analyze them separately, and a clear biological story emerges.
Profiling Immune Cell Populations
Deconvolution-Based Approaches
Spatial deconvolution estimates the proportions of different immune cell types within each ROI. Standard reference profiles (like the safeTME matrix (Danaher et al., 2022)) can resolve many immune populations, though estimates are model-based and depend heavily on the reference matrix used. Common resolvable cell types include:
- CD8+ T cells (cytotoxic)
- CD4+ T cells (helper)
- Regulatory T cells (immunosuppressive)
- NK cells
- B cells and plasma cells
- M1 macrophages (pro-inflammatory)
- M2 macrophages (immunosuppressive/tissue-remodeling)
- Dendritic cells
- Neutrophils
- Mast cells
Marker-Based Approaches
Alternatively, individual gene markers can serve as proxies for immune cell types. This is simpler but less specific — many markers are not cell-type exclusive and can be expressed in multiple biological contexts. Common markers include:
- CD8A/CD8B: Cytotoxic T cells
- FOXP3: Regulatory T cells
- CD68: Macrophages
- CD19/CD79A: B cells
- NCAM1 (CD56): NK cells
Immune Signatures
Composite scores aggregate multiple genes into a single immune activity metric. The Tumor Inflammation Signature (TIS) (Danaher et al., 2018), for example, uses 18 genes to estimate overall immune activation. The related T cell-inflamed Gene Expression Profile (GEP) (Ayers et al., 2017) was developed from the same gene set and validated as a predictor of PD-1 response across tumor types (Cristescu et al., 2018).
These signatures are useful for coarse classification (immune-hot vs. immune-cold tumors (Galon & Bruni, 2019)) but sacrifice the cell-type resolution that deconvolution provides.
Correlating Immune Infiltration with Tumor Biology
Once you’ve characterized the immune landscape, the next step is asking what drives it. Common analyses include:
Immune-Checkpoint Correlations
Which immune checkpoint molecules are associated with which immune cell populations? Commonly observed patterns across published studies (Wei et al., 2017) include:
- PD-1 (PDCD1) and PD-L1 (CD274) correlate most strongly with CD8+ T cells and M1 macrophages
- CTLA-4 tracks with regulatory T cells
- LAG-3 and TIM-3 (HAVCR2) are associated with T cell exhaustion signatures
- TIGIT often correlates with both NK cells and exhausted T cells
These correlations are compartment-dependent — a fact that underscores the importance of compartment-specific analysis. It’s also worth noting that correlation may reflect co-localization rather than direct biological interaction — spatial proximity does not necessarily imply causation.
Biomarker-Immune Associations
For studies evaluating therapeutic targets, a key question is: does the target’s expression predict the immune context?
Some epithelial biomarkers inversely correlate with immune checkpoint expression — meaning that tumors with high target expression tend to have low immune activity. This has implications for combination therapy: if your target marks immune-cold tumors, combining a targeted therapy with an immune checkpoint inhibitor might be more effective than either alone.
Response Prediction
For immunotherapy studies, correlating immune cell proportions and checkpoint expression with treatment response can identify predictive biomarkers. This requires:
- Pre-treatment spatial profiling (to establish baseline immune landscape)
- Clinical response data (ideally RECIST criteria or equivalent)
- Sufficient sample size for meaningful statistical comparison (often the limiting factor)
Pathway-Level Immune Analysis
Beyond individual genes and cell types, pathway-level analysis reveals the functional state of the immune response. Key immune pathways to profile include:
- T cell activation: CD3D, CD3E, LCK, ZAP70, ITK
- T cell exhaustion: PDCD1, CTLA4, HAVCR2, LAG3, TIGIT, TOX, EOMES
- T cell cytotoxicity: GZMA, GZMB, PRF1, GNLY, FASLG
- Antigen presentation: HLA-A/B/C, B2M, TAP1/2, PSMB8/9
- Interferon signaling: IFNG, STAT1, IRF1, CXCL9/10/11
- Immunosuppression: TGFB1, IL10, IDO1, ARG1
Pathway-level analysis reveals functional state, not just presence. Scoring each pathway per ROI and correlating with cell type estimates creates a multidimensional picture of immune functionality — not just “are immune cells there?” but “what are they doing?”
Common Pitfalls
1. Confusing composition with function. High CD8+ T cell estimates don’t mean active anti-tumor immunity. Those T cells might be exhausted. Always pair deconvolution with functional markers.
2. Over-interpreting rare populations. Estimated proportions below 5% are statistically unreliable in most deconvolution frameworks. These estimates are often driven by noise rather than signal — don’t build conclusions on them.
3. Ignoring the stroma. Immune cells in the stroma are often more numerous and more functionally relevant than the sparse immune cells within the tumor core. Don’t neglect stromal ROIs.
4. Single-gene biomarkers. No single gene reliably captures the complexity of the tumor-immune interaction. Composite scores and multi-marker panels are almost always more informative.
The Future: Single-Cell Spatial Resolution
Current GeoMx profiling provides regional resolution (ROIs of ~100-1000 cells). Next-generation spatial platforms — CosMx SMI (He et al., 2022), MERFISH (Chen et al., 2015), Xenium (Janesick et al., 2023) — offer single-cell and subcellular resolution. As these platforms mature, our ability to characterize immune infiltration will move from estimating cell type proportions to directly mapping individual immune cells and their interactions.
At Cytogence, immune profiling from spatial data is one of our core competencies. From experimental design through deconvolution, pathway analysis, and clinical correlation, we help research teams turn spatial data into actionable immunological insight.
References
-
Merritt CR, Ong GT, Church SE, et al. Multiplex digital spatial profiling of proteins and RNA in fixed tissue. Nature Biotechnology. 2020;38(5):586-599. doi: 10.1038/s41587-020-0472-9. PMID: 32393914.
-
Danaher P, Kim Y, Nelson B, et al. Advances in mixed cell deconvolution enable quantification of cell types in spatial transcriptomic data. Nature Communications. 2022;13:385. doi: 10.1038/s41467-022-28020-5. PMID: 35046414.
-
Danaher P, Warren S, Lu R, et al. Pan-cancer adaptive immune resistance as defined by the Tumor Inflammation Signature (TIS): results from The Cancer Genome Atlas (TCGA). Journal for ImmunoTherapy of Cancer. 2018;6:63. doi: 10.1186/s40425-018-0367-1. PMID: 29929551.
-
Ayers M, Lunceford J, Nebozhyn M, et al. IFN-γ-related mRNA profile predicts clinical response to PD-1 blockade. Journal of Clinical Investigation. 2017;127(8):2930-2940. doi: 10.1172/JCI91190. PMID: 28650338.
-
Cristescu R, Mogg R, Ayers M, et al. Pan-tumor genomic biomarkers for PD-1 checkpoint blockade-based immunotherapy. Science. 2018;362(6411):eaar3593. doi: 10.1126/science.aar3593. PMID: 30309915.
-
Galon J, Bruni D. Approaches to treat immune hot, altered and cold tumours with combination immunotherapies. Nature Reviews Drug Discovery. 2019;18(3):197-218. doi: 10.1038/s41573-018-0007-y. PMID: 30610226.
-
Wei SC, Levine JH, Cogdill AP, et al. Distinct cellular mechanisms underlie anti-CTLA-4 and anti-PD-1 checkpoint blockade. Cell. 2017;170(6):1120-1133. doi: 10.1016/j.cell.2017.07.024. PMID: 28803728.
-
He S, Bhatt R, Brown C, et al. High-plex imaging of RNA and proteins at subcellular resolution in fixed tissue by spatial molecular imaging. Nature Biotechnology. 2022;40(12):1794-1806. doi: 10.1038/s41587-022-01483-z. PMID: 36203011.
-
Chen KH, Boettiger AN, Moffitt JR, Wang S, Zhuang X. Spatially resolved, highly multiplexed RNA profiling in single cells. Science. 2015;348(6233):aaa6090. doi: 10.1126/science.aaa6090. PMID: 25858977.
-
Janesick A, Shelansky R, Engblom AD, et al. High resolution mapping of the tumor microenvironment using integrated single-cell, spatial and in situ analysis. Nature Communications. 2023;14:8353. doi: 10.1038/s41467-023-43458-x.
Cytogence provides expert bioinformatics support for spatial biology, immuno-oncology, and translational research. Get in touch to discuss your project.